Zone Leaders
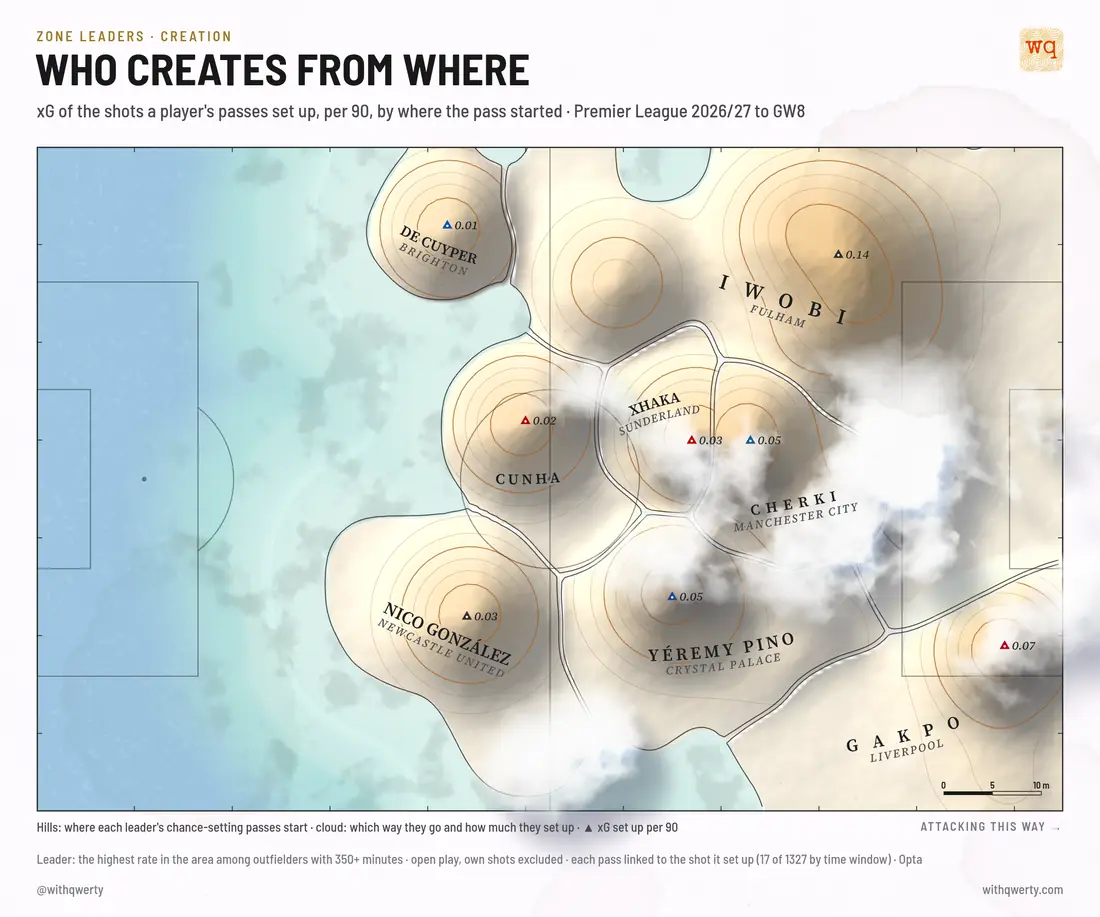
Survey maps of the pitch, each region named after the player who owns it. Three sheets: creation, progression and defending, drawn as relief maps with the sea around them.
- Goes out
- Fortnightly, Wednesday 11:30 UK
- Data
- Opta match events, expected goals and expected threat, Premier League
Methodology
- Creation: the xG of shots set up for others, per 90, by where the pass started.
- Progression: expected threat added by passes and carries, by where they started.
- Defending: tackles, interceptions, clearances, blocks and recoveries, adjusted for how much the opponent had the ball.
- Each region is named after the player who leads it. The area in square metres is the size of the territory they hold.
- Posts as an 8-second loop per map (clouds, lapping sea), with the still as the fallback. Only after a complete gameweek.